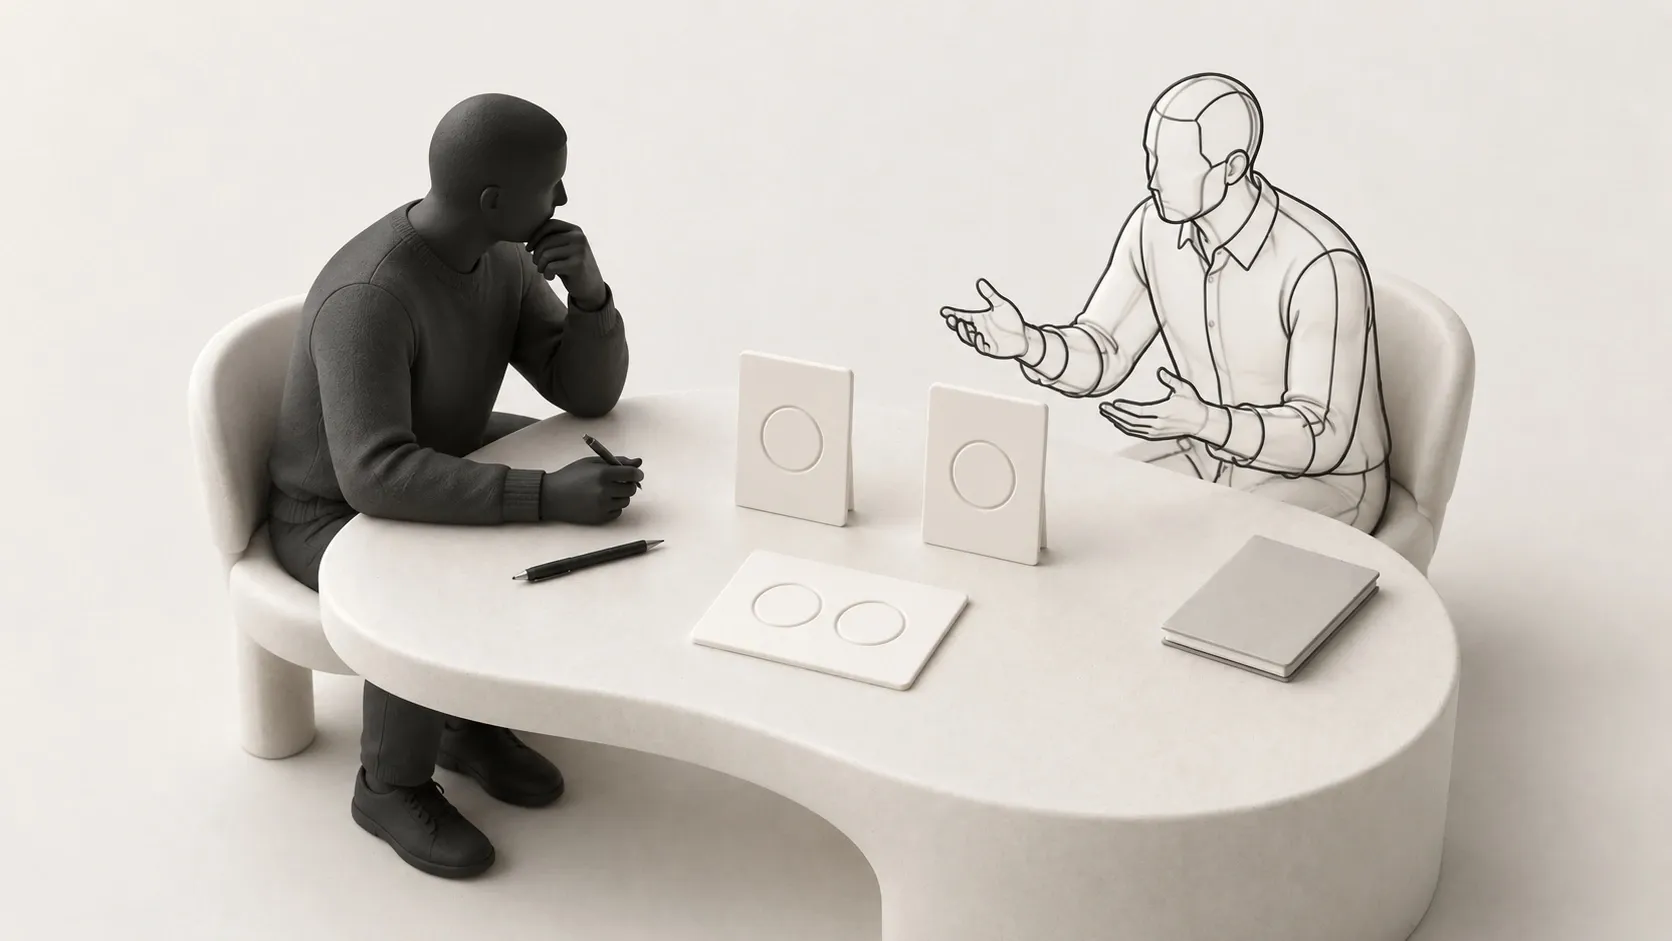
Monadic Testing vs. Sequential Monadic: Guide and Examples
Monadic testing shows each person one concept; sequential monadic shows several in turn. Compare sample planning, order effects and a coffee-offer example.

Monadic testing shows each person one complete concept and compares reactions across separate groups. Sequential monadic testing shows each person several concepts, one at a time. Choose between them by whether you need independent first impressions or a comparison from the same people, then plan the sample and analysis to match.
Choosing between complete concepts? Discuss the exposure design with Sapien and see our comparisons with human research.
Monadic concept testing at a glance
Design choice | Meaning for the study |
|---|---|
Monadic | Each buyer sees one complete concept; compare independent first reactions across groups. |
Sequential monadic | Each buyer evaluates several concepts one at a time; retain order and linked answers. |
Sample planning | Plan valid responses per concept and decision-critical group; sequential designs need paired analysis and order checks. |
Readout | Report assigned, exposed and valid-answer bases. A missing second exposure is not negative intent. |
Evidence limit | Modeled profile counts do not inherit human-sample margins of error. |
How do you plan sample size for a monadic concept test?
Plan valid answers per concept and for each buyer group that could change the decision. If each of two independent concepts needs n valid answers, plan for 2n before exclusions. Agree the difference worth detecting, expected result, analysis and uncertainty with the analyst before choosing n. For a separate budget illustration, suppose that target is 200 valid buyers per concept and you expect to exclude 10% of recruits. Allow 223 recruits per concept (round 200/0.90 up), or 446 total. This is a recruiting allowance, not a power calculation or a guaranteed sample. A sequential plan needs its own assumptions about paired answers, order and people stopping early. Generated profile counts do not have a human-sample margin of error.
Example: comparing two coffee-delivery offers
In this hypothetical study, a coffee-subscription team is choosing which delivery offer deserves a pilot. The target buyers are adults in the contiguous US who bought ground coffee in the past four weeks and help choose it for their household. A-v1 is one 200 g bag every 28 days for USD 15 per delivery; B-v1 is two 200 g bags every 56 days for USD 28 per delivery. Both use the same proposed medium-roast ground coffee, include standard shipping, exclude tax, charge per delivery and allow pausing or cancellation at least three days before the next charge. These are complete-offer comparisons, not an isolated price test. The counts below are teaching data; no responses were collected for these cards. AB and BA identify order; A and B identify the offers.
Design | Details |
|---|---|
Monadic | Example allocation: Half assigned A, half B Record: One concept and one evaluation per person |
Sequential | Example allocation: Half assigned AB, half BA Record: Position and evaluation for both concepts |
For independent appeal, randomly assign target buyers to A or B and show each one card. Use comparable buying criteria, presentation and questions. For a sequence, randomly assign people to AB or BA. Plan the balance in advance and record which card each person sees first. Plan any important buyer-group balance before collecting answers.
Save what each person was assigned and what they actually saw. Someone assigned A who sees B because of a routing error has not received the planned card. Recording both lets the analyst find the problem rather than trust the group label.
In independent groups, each person supplies one evaluation. In a sequential study, both concept evaluations belong to the same person. Keep that link so you can tell a comparison of first reactions from a comparison of two answers by one person.
Question wording and product versions stay fixed
Use the same block after each card: unaided comprehension, relevance, concerns, purchase intent and alternatives. For the positive-intent count, ask: “How likely are you to start this coffee subscription in the next four weeks, at the price and terms shown?” Responses are definitely would buy, probably would buy, might or might not buy, probably would not buy and definitely would not buy. Predeclare the first two as positive; the other three are valid nonpositive answers. Keep declined, missing and not-applicable answers separate from those five choices. Keep the wording, timeframe and labels fixed across cards and retain the full distribution.
Try the cards and questions together before launch. Clarify missing facts consistently in the study version. Explaining only the second card to someone who is confused changes the comparison, unless that extra explanation is what you intend to test.
Qualtrics’ concept program guidance documents single and sequential setups. Agree whether the main result should reflect a first reaction or an evaluation made after another concept.
Read the AB/BA comparison before naming a winner
Sequence | Details |
|---|---|
AB | First concept: positive: A: 30 of 50 (60%) Second concept: positive: B: 21 of 50 (42%) |
BA | First concept: positive: B: 29 of 50 (58%) Second concept: positive: A: 22 of 50 (44%) |
Our four aggregate records and copyable CSV contain counts for 100 people, 50 in each sequence. The same predeclared positive-intent outcome applies throughout.
All four aggregate records
Each row is labeled evidence_type=fictional_teaching_data. The n is the number of answers for that concept and position. Positive is the positive-intent count; positive_share divides it by that row’s n.
Sequence / concept / position | Aggregate values |
|---|---|
AB / A / 1 | n: 50 positive: 30 positive_share: 0.60 |
AB / B / 2 | n: 50 positive: 21 positive_share: 0.42 |
BA / B / 1 | n: 50 positive: 29 positive_share: 0.58 |
BA / A / 2 | n: 50 positive: 22 positive_share: 0.44 |
The position pattern is larger than the pooled lead
Positive intent by concept and exposure position
Concept | Details |
|---|---|
A | First: 60% Second: 44% Change: −16 points |
B | First: 58% Second: 42% Change: −16 points |
Pooled: A 52% · B 50% · 100 people total
There are 50 people in AB and 50 in BA, 100 total. First- and second-position rates compare the two sequence groups. They do not show how an individual’s answer changed.
A has 30 positive answers in first position and 22 in second, or 52 of 100 overall. B has 29 and 21, or 50 of 100 overall. A’s rates are 60% and 44%; B’s are 58% and 42%. Both concepts score 16 percentage points lower in second position.
Check that position pattern before using the two-point overall lead to decide which concept has stronger independent appeal. Fatigue, anchoring or the comparison itself could explain it. These totals cannot tell you which happened or how a particular person’s answer changed.
Choose a follow-up that answers the remaining question
Do not develop A just because 52% is higher than 50%. Check the survey length, instructions and whether people understood the first card. If the decision still depends on independent appeal, show the remaining offers to separate groups in a focused follow-up.
An analysis of first reactions can be useful when planned in advance. It compares the A-first people in AB with the B-first people in BA. It does not compare two answers from one person. Choose that analysis for the research question, rather than after seeing that it favors your preferred concept.
If a concept is confusing only in second position, check its wording and what people may have learned from the first card. Both can cause problems. Design the next study to answer the important unresolved question.
A missing second answer is not a rejection
If someone finishes A and stops before B, keep A and record that the B display or answer is missing. Do not count it as negative intent. More people dropping out of one sequence can change the later-position results and the comparison between groups.
Report how many people were assigned, saw a card and gave a valid answer, by sequence and position. Distinguish a display failure, a skipped optional question and an actual nonpositive answer. Each leaves you with different evidence.
Plan the main analysis and any analysis limited to people who answered both concepts before fieldwork. The people with complete pairs may differ from those who answered the first card. Show the numbers for each group.
Paired comparisons need linked answers
Keep each person’s answers linked to the records of what they saw.
participant_id / sequence | Details |
|---|---|
P01 / AB | concept / position: A / 1 response_id, exposure_id, stimulus_version and positive_intent: P01-QA; P01-E1; A-v1; positive_intent=1 |
P01 / AB | concept / position: B / 2 response_id, exposure_id, stimulus_version and positive_intent: P01-QB; P01-E2; B-v1; positive_intent=0 |
P02 / BA | concept / position: B / 1 response_id, exposure_id, stimulus_version and positive_intent: P02-QB; P02-E1; B-v1; positive_intent=1 |
P02 / BA | concept / position: A / 2 response_id, exposure_id, stimulus_version and positive_intent: P02-QA; P02-E2; A-v1; positive_intent=1 |
These four rows show how to store the records; they do not recreate the 100-person totals above. Participant ID links a person’s answers, response ID identifies an answer, exposure ID identifies a display and position records the order. Here 1 means definitely/probably would buy; 0 means another valid intent answer. Keep missing and not-applicable answers separate.
For a paired comparison, count people positive to both concepts, A only, B only and neither. The A-only and B-only counts show disagreement within a person. The overall shares for A and B do not tell you those counts. NIST’s McNemar reference explains why a paired binary comparison needs them.
The sequence totals narrow the possible counts, but do not reveal the actual pairs. In AB, between 1 and 21 people could be positive to both concepts; in BA, between 1 and 22. Across both sequences, that allows 2 to 43 positive to both. At one endpoint, 50 are A-only and 48 B-only. At the other, 9 are A-only, 7 B-only and 41 neither. Both possibilities match all four sequence totals. They are possible tables, not recovered study results.
The number positive to only one concept can therefore range from 16 to 98 with the same two-point difference overall. Calculating uncertainty for a paired comparison still requires the actual linked answers. The totals limit what is possible; they do not supply the missing pairs.
These limits explain why you need the actual links. You cannot choose a possible table as though it were the result. For a simulated study, also keep the run ID, how the run was built and how its outputs relate. A run ID does not identify a human participant.
Questions about monadic testing
What is monadic price testing?
A monadic price test randomly assigns each eligible buyer to one complete offer at one price, then compares the same outcomes across independent price groups. Keep the product, terms, presentation and audience matched when price is the variable. The coffee example in this guide changes both delivery quantity and schedule, so it compares complete offers rather than isolating a price effect.
Which needs a bigger sample, monadic or sequential monadic?
For the same valid-answer count per concept, independent monadic groups generally need more people because each concept has its own group. Sequential monadic reuses people, but the analysis must allow for paired answers, order and missing later responses. Set the sample for the difference and uncertainty that matter. Fewer recruits do not automatically give equal precision.
The recommendation depends on what people saw
A useful report names the concept to develop or revise, the result behind that choice and any effect of what people saw first. It should let another reviewer find the card, questions, answer counts and proposed follow-up.
In human research, the sample design and links between answers affect uncertainty. In a simulated study, assignment helps you check how results change across conditions. It does not create a human sample. Check how the audience was built and validated for the question.
For this A/B comparison, an independent follow-up is useful if the development choice still depends on first reactions. Run it to answer that question, rather than to rescue A’s overall lead. Our concept examples guide shows what the resulting evidence should change.
Copy the data
sequence,concept,position,n,positive,positive_share,evidence_type
AB,A,1,50,30,0.60,fictional_teaching_data
AB,B,2,50,21,0.42,fictional_teaching_data
BA,B,1,50,29,0.58,fictional_teaching_data
BA,A,2,50,22,0.44,fictional_teaching_data
Further reading
If the next investment depends on first impressions, discuss an independent concept comparison with Sapien and agree how the simulated audience and exposure should be checked.